
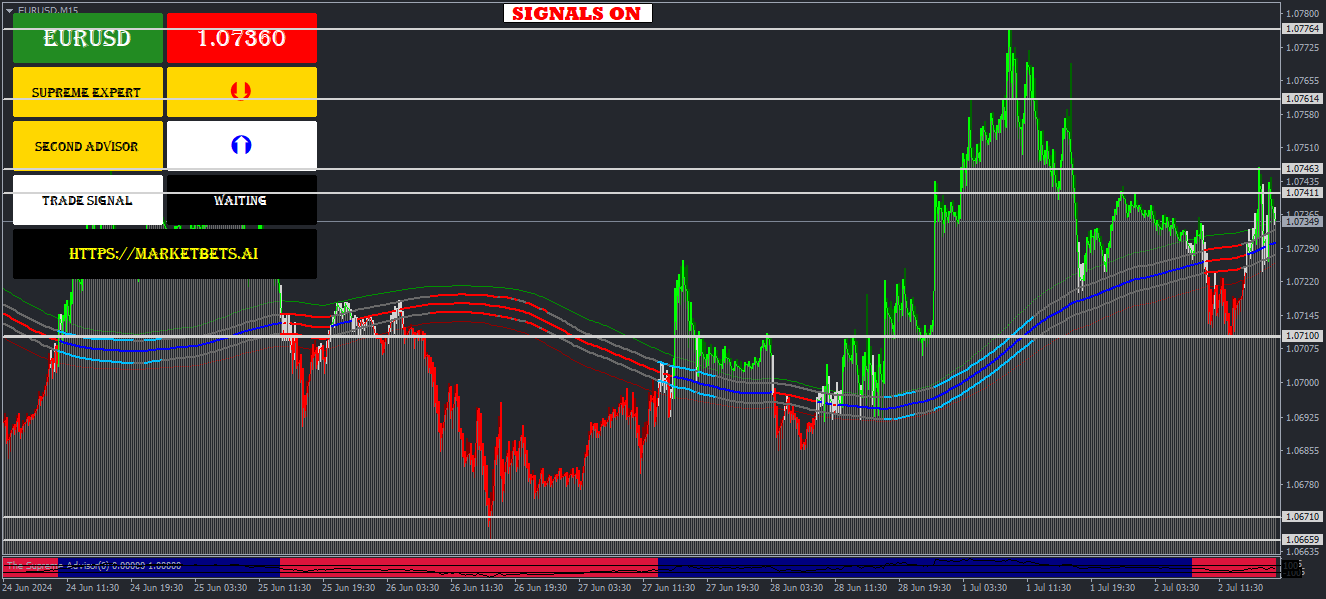
 To the left of the chart, you’ll find a box containing the trading signal 🚦 after the agreement of AI-driven experts 🤖. All opinions must be in agreement 🤝. In case of a sell signal 💸, the gray line above the sell point is the stop-loss 🛑, and the gray line below the sell point is the first profit-taking level 💰. The second line is the second profit-taking level 💸. Calculate your risk carefully 📝 before entering any trading position based on this information 🧐.
Views: 0